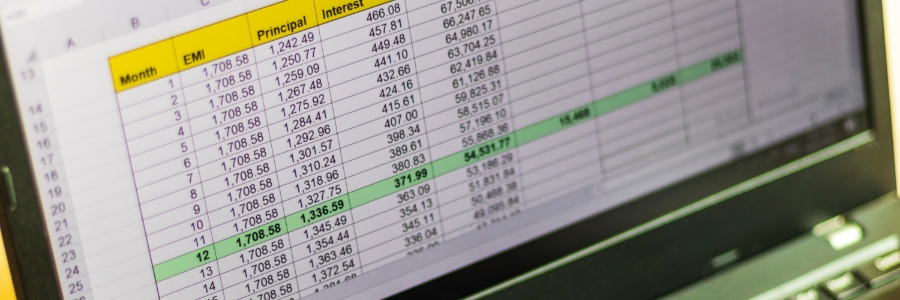
Want to make your Excel data easier to grasp with a quick look? Using charts and sparklines can transform raw numbers into clear, insightful visuals. This article will guide you through setting up and editing charts and sparklines.
What are Excel charts?
Excel charts are visual representations of data that help you quickly identify trends, make comparisons, and gain insights without needing to analyze rows and columns.
Excel 101: How to use charts and sparklines to visualize data

How to use Excel slicers
Microsoft 365: The SMB’s secret weapon for growth

As a small- or medium-sized business (SMB) owner, you know that growth is essential for success. But achieving growth can be difficult, especially when you're working with limited resources. That's where Microsoft 365 comes in.
Do more with less
Microsoft 365 is a comprehensive suite of tools and services designed to help SMBs get more done.
Take your Excel skills to the next level
Level up your Excel skills with these tips
Microsoft Excel’s new features now make it easier than ever to process data and present information visually. Level up your spreadsheets with the tips below:
Take advantage of Ideas in Excel
If you’re not sure which type of chart best tells a particular story out of a table of data, don’t worry — Excel’s artificial intelligence has got your back.
Google Drive upgrade: Commenting on MS Files
Google constantly strives to boost user experience by regularly updating their series of tools and applications. This time around, they added a new feature to Google Drive wherein users can add a comment directly on the ‘Preview' pane of Microsoft Office files, images, and PDFs. Read on to find out how this can benefit your business.

